Planning a Microgrid
What is the timeline to deploy a microgrid?
The figure below shows an expected timeline for microgrid deployment. xiv Expanding upon information from PG&E, the expected length of microgrid deployment would be 3 to 5 years. This is an estimate for community microgrids with established infrastructure and closer distances to the main utility grid. This is the expected length of microgrid deployment if funding and resources are available. A timeline to reflect estimates for deployment in rural and remote communities is added below.

Figure 3: Expected Microgrid Timeline xv,xvi
However, if difficulties in communication and differences in priorities exist, rural and remote communities may take longer in all stages of microgrid deployment. For projects in these areas, the timeline can be significantly longer due to complications in construction and permitting. Without confirmed funding and resources, deployment may range from 5-20 years.
How do I plan the details of a microgrid?
Simulation is a key activity to design a microgrid given the various complex factors in play. Simulations are typically used in the early design stage to give an understanding for microgrid performance. They are used to test and optimize designs prior to implementation, reducing possibilities for flawed and/or ineffective designs. This process is essential for finding cost effective solutions that are tailored to a particular community microgrid.
There are several software options available for microgrid capacity simulation, and four options are compared below. Though interesting to explore, a working knowledge of how to use the modelling software is not required for use by community members. However, microgrid integrators should have access to at least one of these software options or some equivalent.

 Microgrid modeling software comparison based on original table from Mayfield Renewables
What is the price and scaling of a microgrid?
The figure below gives a sense of scale and cost for different sizes of microgrids. Using the expected power generation capacity and estimated cost per kW, community members can determine a rough estimate for total costs of DERs.

Note that the costs may be different depending on location and developers. Rural and remote microgrids may cost more depending on access to transmission lines and the main grid.xviii This all reinforces the importance of conducting techno-economic analysis with proper professionals in the field.
What payment paths are there?
There are two main paths that can be taken to pay for a microgrid – direct purchase or a power purchase agreement (PPA).
Direct purchase is simply buying the system from a microgrid provider or set of providers, paying up front for the system as a Capital Expense, or ‘CAPEX’ cost.
A power purchase agreement (PPA) involves the microgrid provider installing the system but maintaining ownership of the equipment, instead selling power to the customer for a fixed rate. This is also referred to as ‘energy-as-a-service’ and makes paying for the microgrid an Operating Expense, or ‘OPEX’ cost.
Some of pros and cons of each path are shown below:

What funding opportunities exist?
Find information about funding opportunities for microgrids from the links in the table below. Note that these opportunities change over time!
Source Level | Source | Description | Link |
Private | MicrogridKnowledge.com | A website dedicated to everything microgrids | |
Federal | DoE | Community Microgrid Assistance Partnership | Community Microgrid Assistance Partnership | Department of Energy |
Federal | DoE | Microgrid Program Strategy | |
Federal | Grants.gov | How to search for federal govt grants | |
Federal | Grants.gov | Grant-making Agencies | |
Federal | Grants.gov | Federal Grant Eligibility | |
Federal | DoC | Department of Commerce Grant opportunities | Grants and contract opportunities | U.S. Department of Commerce |
Washington State | Commerce | Washington State Clean Energy Funds | |
Maryland | DoE | Maryland Energy Administration Accepting Clean Energy Grant Applications | |
Private | Carbon Credits | Academic paper on carbon credits and microgrids | https://www.sciencedirect.com/science/article/pii/S2405844024151377 |
What are the rules and regulations to be aware of?
It’s important for community stakeholders to understand the rules and regulations involved with clean energy microgrids. These regulations are imposed at the federal, state and local level. Regulations come in two forms: policy and technical standards for microgrids. Policy regulations are concerned with how communities set up microgrids and, for example, how they interact with the larger national grids. Technical regulations are concerned with technical standards for how they are built.
Although there are not too many requirements imposed by federal and state governments, microgrids are becoming increasingly utilized by communities all over the country. With more communities adopting microgrids, more attention will be placed on them as a concept and interest and oversight from the government should be expected. The energy environment, not just microgrids, is rapidly developing and regulation and legislation pertaining to it will follow.
Description | Link |
Public Utility Regulatory Policies Act of 1978 | |
FERC Order No. 2222 | FERC Order No. 2222: Fact Sheet | Federal Energy Regulatory Commission |
Overview of Microgrid Regulation in the USA | Microgrid Regulatory Policy in the US | Greentech Renewables |
Interconnection Standards |
Case Study – Klaas and Mary-Howell Martens Farm
Background
In order to understand the usefulness of microgrids as well as to verify the contents of the guide, the team reached out to a farmer named Klaas Martens. Klaas is a farmer based in Penn Yan, NY who maintains a diverse variety of produce such as artisan wheat, organic wheat, oats, rye, corn, soybeans, dairy, etc.
Rural communities tend to lack adequate infrastructure considering the energy demands for maintaining a farm. Typically, these areas have poor power quality and unstable voltages, which lead to burnt-out electric motors and cooling systems. Due to the nature of the electrical infrastructure, upgrades require significant costs. In fact, the utilities wanted half a million dollars to expand electrical infrastructure. In order for Klaas to continue his operations, Klaas needed improved service through renewables.
Klaas wants clean and good power quality at a lower cost. Solar energy appealed to him because of better power quality and lower reliance on diesel energy generation (saving costs for fuel and improving local air quality).
Simulation – System Model Advisor (SAM)
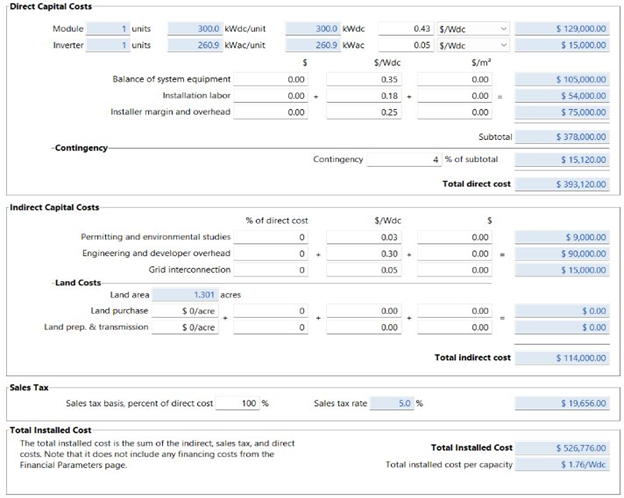
For the section, the process of modeling Klaas’s 300 kW solar photovoltaic (PV) system was simulated using System Advisor Model (SAM). As a reminder, these simulation exercises are meant to be simple and preliminary. They reveal an expected cost as well as expected output energy.
All simulations and modeling should explicitly mention assumptions. Certain assumptions are needed as inputs in order for the model to function as smoothly as possible. Note that assumptions may cause deviations from real world results, but the scale of the results should be similar or close. The following assumptions were used for this model:
Assumptions
- Uses farm location (1443 Ridge Rd Penn Yan, New York 14527)
- 300 kWdc Fixed open rack system
- Listed as a “Commercial” solar farm
- 25-year analysis period
- Other parameters default such as electrical load (or usage)
The results of the model are listed below.
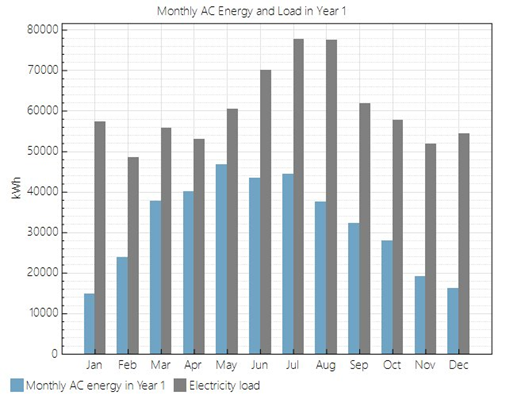
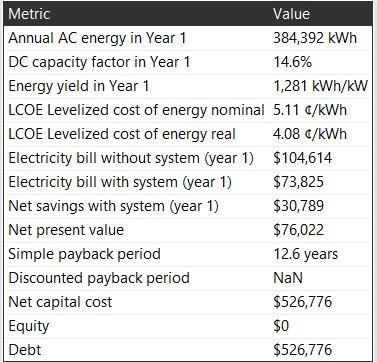
SAM is able to output a summarized value of important metrics. For example, it covers the annual AC energy for the first year. Other economic results are listed such as the net present value. A positive net present value indicates that this is worth the investment.
Try it for your community!
Link to SAM: https://sam.nrel.gov/
Verification and Validation of Results
A discussion with Klaas reveals differences in the simulated and expected outputs. However, Klaas agrees that the results are primarily similar but with a few key notes:
- Wiring and trenching of electrical infrastructure led to staggering increase ($500,000 from simulation result vs $1 million expected)
- 30% Tax Credit from the Investment Tax Credit (ITC) and NYSERDA help to offset costs
- Approximate 15 cents/kWh (tax credits have taken amount down) vs 25 cents/kWh from current operation
- estimates payback period but he thinks 12 years may be an overestimate with payback being faster since they would offset diesel
This reveals that there are limitations with the current modeling system. For example, SAM runs under the assumption that there is already mature electrical infrastructure which may not be relevant for rural and especially remote communities.
We are currently in the process of refining the model and obtaining more information. The hope is that the output of the simulations will be comparable to the estimates provided by the renewable energy company that is developing Klaas’s system.